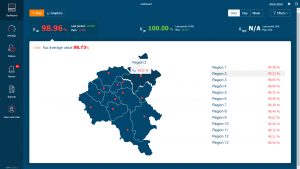

Vision Analytics addresses the “4 Vs” of big data: velocity, volume, variety and veracity. Its engines leverage scalable cloud processing to manage a nearly limitless number of static, dynamic or event-based datasets to help broadcasters, MVPDs and OTT service providers quickly address issues and take corrective and preventative action. The software samples video content and aggregates data from a variety of systems and components throughout the ecosystem to understand and correlate the factors that contribute to higher engagement. With a reliable data set, users can develop a host of analysis results, visualizations, and automated reports to suit unique business needs.
Qligent has added several important new features to Vision Analytics for IBC2019:
- Key Quality Indicators(KQIs) with specific performance parameters for broadband and internet delivery
- Service-independent correlation engines to identify and reconcile problems over any delivery network
- An intuitive Reports Builder application that allows users to create actionable reports, customizable to each service
- A new Dashboard Constructor for web and mobile devices that allows users more flexibility in adding widgets, graphs and other customized reporting elements meaningful to their operations
- A refined predictive analytics model to more effectively combat buffering issues for IPTV, OTT and mobile delivery services
Qligent’s unique deployment of networked and virtual probes creates an end-to-end, controlled data mining environment to produce trusted and secondary opinion datasets within Vision Analytics. The analytics engines are never thrown off by variables, such as operator error, viewer disinterest, or user hardware malfunction, assuring that the integrity and variety of the data is maintained. All findings are presented on a user-friendly dashboard and reports that summarizes key performance indicators (KPIs), key quality indicators (KQIs), and other vital criteria pertaining to multiplatform content distribution across creation, delivery, and consumption.


