Each quarter, TiVo seeks real consumer opinions to uncover key trends relevant to pay- TV providers, digital publishers and CE manufacturers. The 17th edition of TiVo’s quarterly video trends report (previously the Digitalsmiths Quarterly Video Trends Report), released today, includes insights on pay-TV vs. over-the-top (OTT) user experiences, live sporting event viewing via social media and more.
Based on a survey of more than 3,000 consumers in North America, the Q1 2017 Video Trends Report covers key quarter-over- quarter (q/q) and year-over-year (y/y) trends. TiVo enables pay-TV providers, digital publishers, and consumer electronics (CE) manufacturers to power personalised search, recommendations, carousels, and social and sports discovery, while gaining invaluable insights into these features through analytics. TiVo’s customers include Charter, DISH Network, DIRECTV, Sharp Electronics and other leading global pay-TV providers, broadcast networks and CE manufacturers.
Consumers’ genuine, unbiased perspectives and feedback drive continuous improvements to TiVo’s Seamless Discovery, the industry’s leading personalised content discovery platform, and Seamless Insight, a reporting tool that delivers the analytics necessary to optimise content discovery.
TiVo shares these findings for the same reason it uses them—in the hopes that video service providers leverage the information to improve and develop applications and features that will enhance the overall TV viewing experience offered today.
This survey has been conducted every quarter since 2012, enabling the company to track key trends in viewing habits, identify consumer opinion of pay-TV providers and monitor emerging technologies, streaming devices, TV Everywhere (TVE) apps and content discovery features, such as personalised recommendations.
Here are the summarised the key findings from this report that are relevant for Asia-Pacific.
It’s important for pay-TV providers to understand respondents’ engagement levels with the channels offered to them, as well as respondents’ ability to find something to watch while navigating the pay-TV experience. According to Q1 2017 survey results:
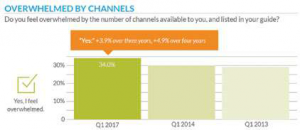
34% of respondents are overwhelmed by the number of channels available to them, and this percentage has increased 3.9% over three years, and 4.9% over four years.
It’s important for pay-TV providers to understand respondents’ engagement levels with the channels offered to them, as well as respondents’ ability to find something to watch while navigating the pay-TV experience. According to Q1 2017 survey results:
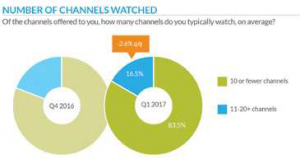
On average, 83.5% of respondents watch 10 channels or fewer from their pay-TV service. Based on the 2.6% q/q decline in those who watch 11 or more channels, this report concludes that respondents are watching fewer channels.
Below is a breakdown of SVOD viewership trends in Q1 2017:
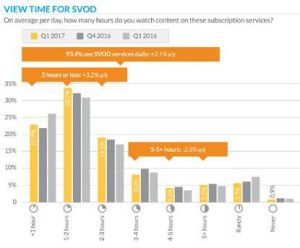
93.4% of respondents watch SVOD services daily, a habit that increased slightly q/q and 2.1% y/y.
The largest group (75.7%) watches three hours or less per day of SVOD content, an increase of 3.2% q/q.
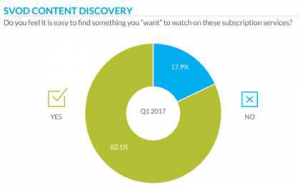
User experiences and content discovery within SVOD services continue to be superb with 82.1% of respondents answering they are pleased with their ability to find something to watch on SVOD services — the highest level of satisfaction for this question across all survey results dating back to Q3 2015, when it was added.
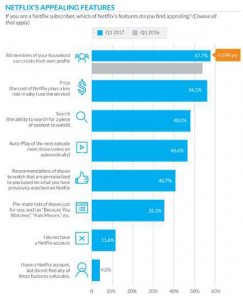
Because Netflix is the clear leader in the SVOD industry, it’s important to understand why the service appeals so strongly to respondents. For the fourth quarter in a row, the top three most appealing Netflix
features are:
“All members of your household can create their own profile” – 57.7%, a slight increase q/q, and 3.9% y/y.
“Price (the cost of Netflix plays a key role in why I use the service)” – 56.1%
“Search (the ability to search for a piece of content to watch)” – 48%
Based on these benefits, it seems pay-TV providers may not be rolling out user experience upgrades such as recommendations as fast as consumers want them. Streaming services have the technical ability to test/update UIs more easily and quickly compared to a set-top box — could this be yet another competitive advantage over pay-TV, resulting in less churn because content is easier to find?
In Q1 2017, 65.2% of respondents answered they are frustrated “always” or “sometimes” when trying to find something to watch on TV. Overall frustration increased 2.2% y/y and 3.4% over two years. Another source of frustration when navigating the myriad of available content sources and platforms is inconsistency in content availability.
As consumers become increasingly connected and mobile, many are discovering some content is only available on certain services, devices, or platforms — or specific episodes and seasons are trapped behind additional pay walls. In Q1 2017, 28.4% of respondents stopped watching a show they previously enjoyed because it became too difficult to access.


